Customer Retention and Churn Analysis
Every business wants to woo their customers by providing them the best experience that they can. In such scenario it is pertinent to understand the behavior of their customers so that company sales, marketing and promotions strategies can be made effectively around those behavior, such that they generate the maximum impact. There has been a lot of work going on around this problem using Big Data Analytics and a lot of budget dollars are being spent by the enterprises to understand and target their customer in most effective manner.
Anlysis we are going to do to understand the customer churn and retention.
- Cohort Analysis
- Customer Lifetime Value
- Customer behavior movement
1. Month-on-month cohort analysis
We look at month-on-month retention of customers recruited in a month. Say if we recruit 100 customers in a month, how many of them stay and are active in 2nd month and how many of them are active in month after that, so and so forth. Plot below shows the percentage of customers who transacted in the nth month after enrolment.
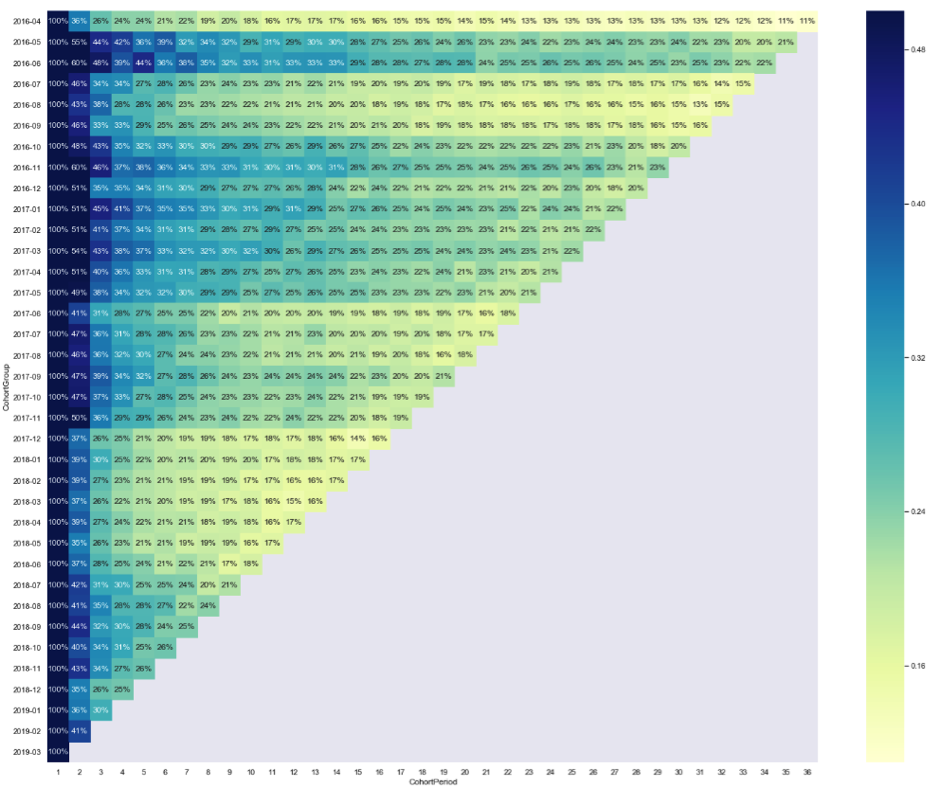
Observations from M-o-M cohort analysis plot
We can observe from the plot above that:
- The user retention drops drastically (>50% in general) after the first month.
- The user footfall keeps dropping significantly for few more months until the figure reached around 20-30%
- The user retention stabilises after 6-7 months and then the drop is gradual.
2. Understanding Lifetime Value of customer
Definition of Customer value in this context is Average Spend Value per month after N months since enrolment for each cohort. Plotting month on month Average Customer Value per month after enrolling
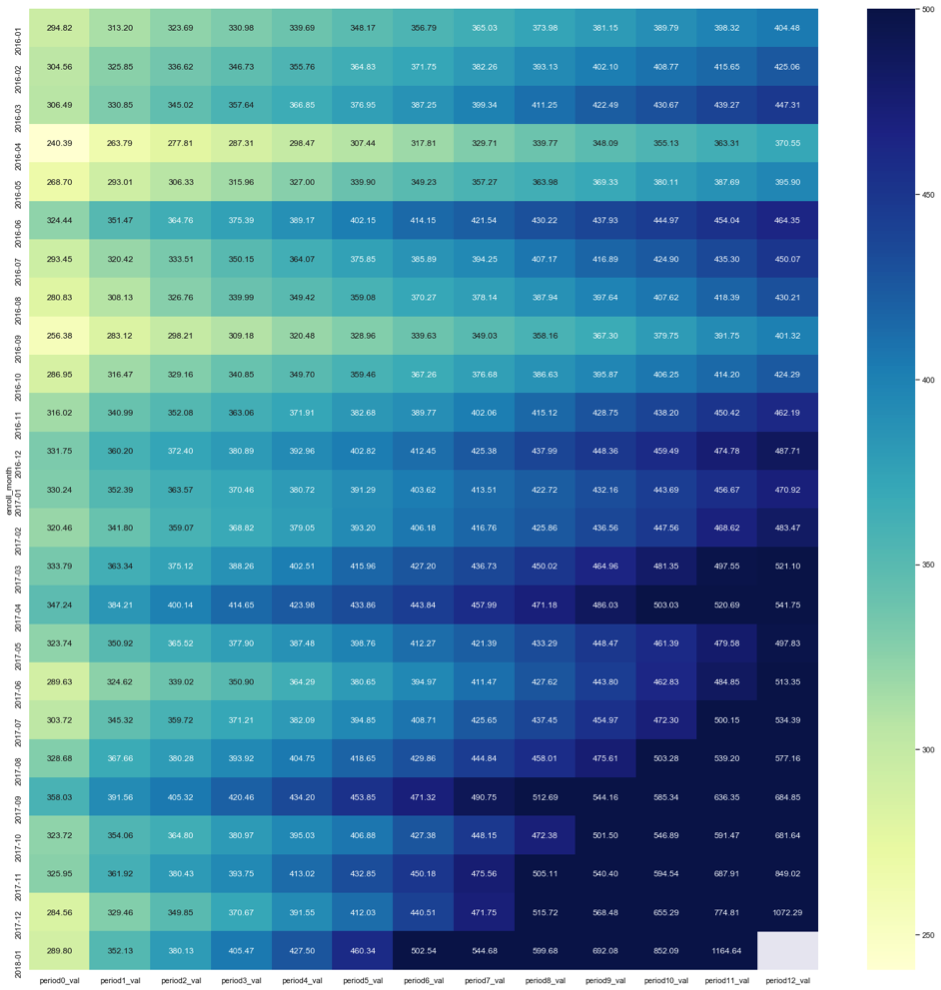
A cell in this plot shows us the average lifetime value per month of a customer in Nth month after enrolment. We can observe from this plot and the one above that:
- The customer’s monthly LTV is increasing as the time moves on. We have seen from the above user retention chart that the customers are getting churned as the time moves on. Considering both the observation it is evident that as time moves on only the valuable customers remain for a monthly cohort. And these customers are stable and transact for long time increasing the average lifetime value.
- If we look closely, we can observe that the increase in the value is not constant or monotonic and follows a trend.
- The increase in customer value is high in the beginning as lot of one-time customers drop after first few months and never come back. Then the rate of increase drops down to a lowest after 5-6 months in the years 2016-17 and after 3-4 months in years 2017-18. This suggests a change in customer behaviour over the years.
In order to quantify the same we look at month on month CHANGE in Average customer value / month after enrolment.
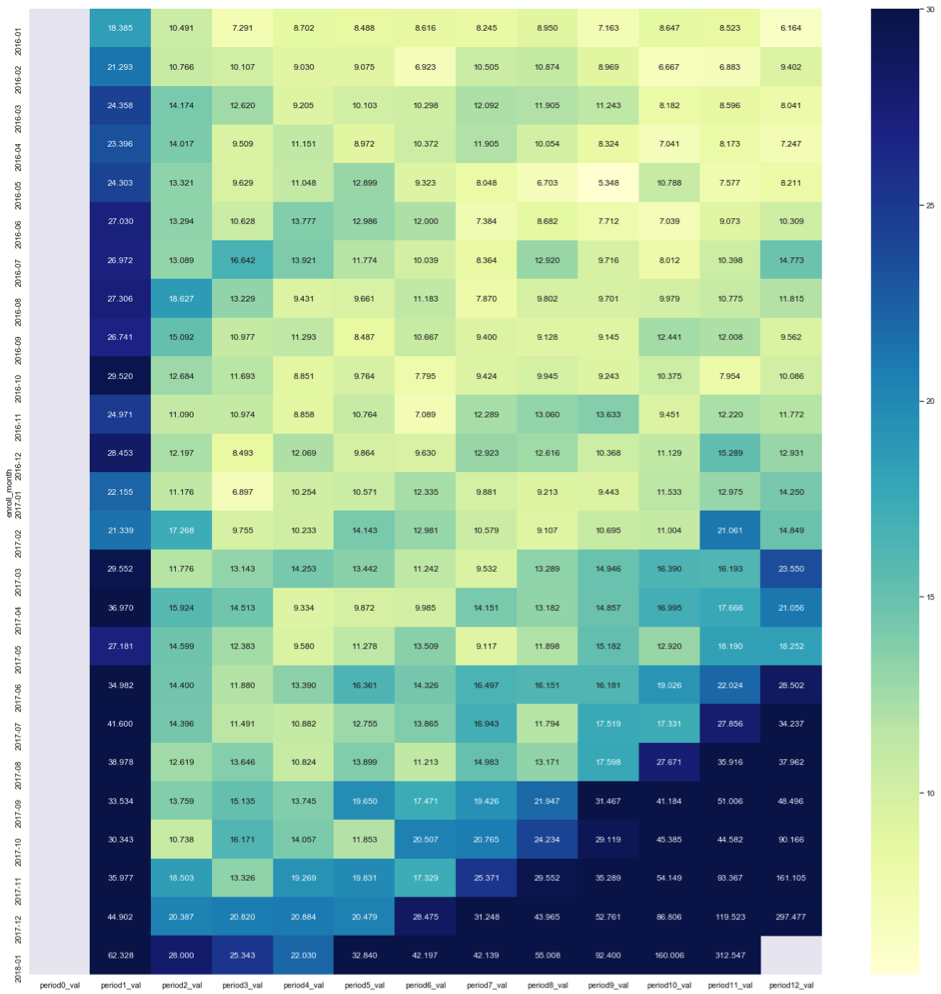
In the chart above we can easily observe that the change in CLTV per month decreases initially for a few months and then starts increasing gradually. To observe this trend more clearly we average the change over 6 months cycle and plot it again.
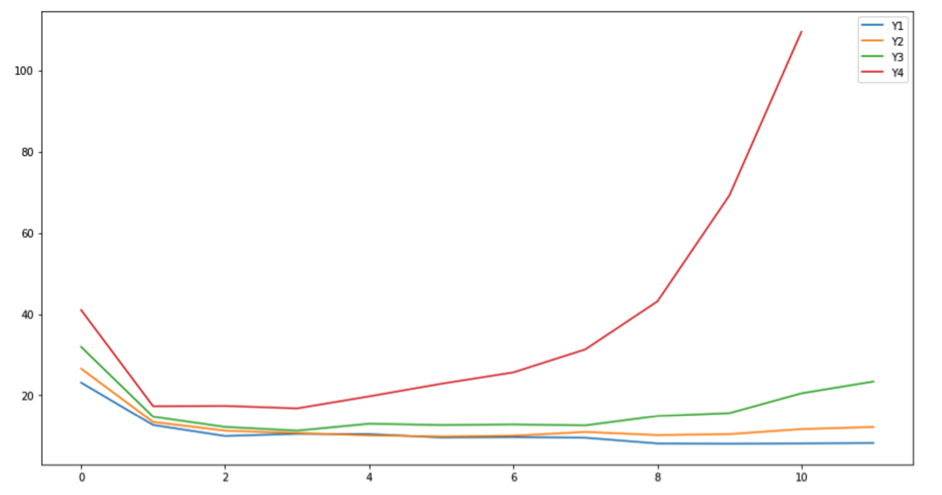
Here we can observe that the change in customer value is decreasing for first 8-9 months initially and 5-6 months later on. Then it starts increasing gradually for first two averaged data over contiguous timelines. And in the last two contiguous timelines the decrease in change can be seen to happening till 3-4 months and then increasing . This suggests that for recent years the newly enrolled customer’s behaviour has changed significantly and we can interpret 2 things:
- The non-sticky customers drop out earlier than what used to happen earlier.
- The customers are stickier after 3-4 months than what used to happen earlier. The more stable customers are recognized earlier and the customer value starts increasing after 4-5 months in recent years.
3. Movement of customers based on their visit pattern
As observed above the customer behaviour change is observably evident to happening at period of
- 3-4 months
- 5-6 months
- 8-9 months
Given the above fact it will be only prudent to analyse the customer behaviour more deeply at around these periods. So we try to generate the customer’s quarterly transcation patterns and analyse it to find more useful insights. To carry out this analysis we divide the customers into buckets based on the number of visits. Based on customer’s quarterly transcation data we observed the quartiles are divided at 1,2 and 5, which results in 5 buckets including the drop-offs.
Next we create a sankey diagram observe the movement of customers across these buckets for each quarter.
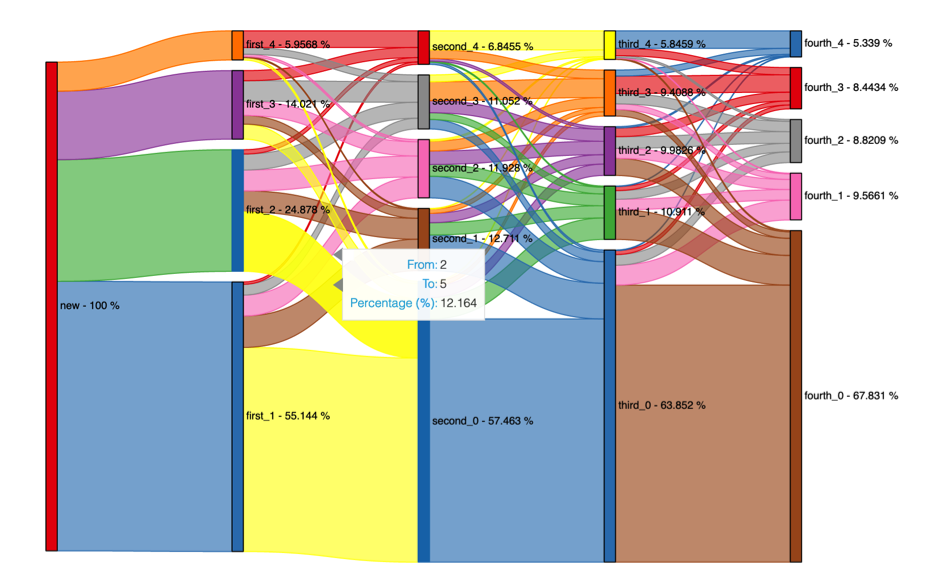
Observations from Customer Movement Behavior
From the plot above we can observe how the customer movement happens across the buckets. Some of the observations are as follows:
- 55% of the new customers don’t transact in next quarter after their first transaction and 35% of total never come back after first transaction.
- After first 3 quarters about 70% of the customer would have churned.
- If a customer spends multiple times in first quarter then there is high probability that customer is going to come back again for considerable periods. As we can see from the top bucket that the drop percentage from that bucket is quite nominal.
Conclusion:
The analysis we studied above is an initial step in the journey to understand the customers behavior. This is just an exploratory analysis, which gives us some hint towards the direction we should put our further efforts in. Looking at the retention analysis one can understand the churn rates of a business which gives us a direction towards targetting the customer who are more likely to churn. Further, Customer Lifetime Value provides us insight towards if the customers are sticky and are providing enough value to the business, one can also guage the period after which stickiness of customers increase. One of the insights that Customer Movement Behavior gives us is visit pattern characteristic of the customer who are posed to drop off or who are going to be retained. All of the above exercise can be used to further drill down to study the customer behavior more closely and creating marketing and sales strategy which result in maximum impact.